Buying, selling and operating apartments in Portland
Portland Apartment Market (4 county area) Sales History 2007-2012
Leave a Comment
<<<Portland Apartment Market History_1March14>>>
RIGHT-CLICK ABOVE LINK (and save target) TO DOWNLOAD COMPLETE REPORT
Attached is a history of Portland apartment sales sorted by neighborhood from 2008 – 2013 of transactions > $450K.
The report covers the Portland Metro area – Clark (WA), Clackamas (OR), Multnomah (OR) and Washington (OR) counties
Contents Include
2008 – 2013 Portland Apartment Market History w/ Comments
2013 Portland Operating Dynamics Trends
2008 – 2013 Sales by County
2008 – 2013 Sales by Neighborhood
2008 – 2013 Sales by Complex Size
2008 – 2013 Sales by Decade Built
2008-2013 Summary by County and Totals
Individual Portland Apartment Sales >$450K – August 2013 + 1H2013 Summary
Leave a Comment
<<<Aug13vsAug12_PortlandAptSales>>>
RIGHT-CLICK ABOVE LINK (and SAVE LINK AS) TO DOWNLOAD THE DETAILED REPORT
Attached is a list of individual Portland-area sales of apartment complexes greater than $450,000 in August 2013. Included are $/unit, $/sqft , unit count, year built and Cap Rate (as reported) and a comparison to August 2012 averages.
2013 First Half Summary and Projections:
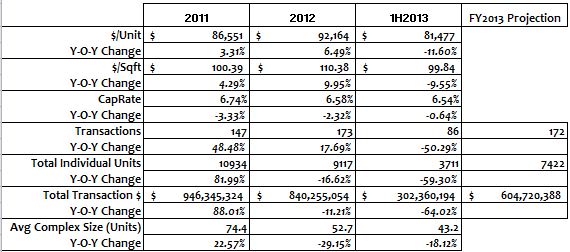
2013 should be about the same volume as 2012 with the exception of fewer large complex sales.
Future directions will be determined by two things:
1) Interest rates – Are gradually increasing which means Cap Rates usually track.
2) Rents – For the next year, we will be hitting a ceiling in rent increases, however demand should stay steady. This means owners need to focus on two things:
a. Getting/keeping good tenants – Even if this means waiting longer on vacancies. If you’ve spent money making your apartments better do advertise this.
b. Managing expenses – The rise in utility rates is inexorable for now, especially water since most water is from the City of Portland which does not need regulatory approval for rate increases. While bill-backs are popular, sub-metering is an option you may want to consider since it encourages tenants to use less water as opposed to a flat fee.
Side note for apartment owners – The Oregon legislature has passed a bill which will not allow a landlord to base tenant acceptance on whether they use an individual Section 8 voucher for rent payment. Details are at:
http://gov.oregonlive.com/bill/2013/HB2639/
This will become effective 1 Jul 2014.
If you’d like more information on:
– Details/background on individual sales in the report, or
– a Free copy of our 80-page book – Buying, Selling and Operating Apartments Using Financial Analysis
Please contact me:
Steve Morris – Senior Advisor Multi-Units
Sperry Van Ness – Bluestone & Hockley
steve.morris@svn.com / (503) 970-4593
Individual Portland Apartment Sales >$450K – July 2013
Leave a Comment
<<<Portland Apartment Sales_July2013>>>
RIGHT-CLICK ABOVE LINK (and SAVE LINK AS) TO DOWNLOAD THE DETAILED REPORT
Attached is a list of individual Portland-area sales of apartment complexes greater than $450,000 in July 2013. We’ve included $/unit, $/sqft , unit count, year built and Cap Rate (as reported) and a comparison to July 2012 averages.
COMMENTS – The number of transactions tailed off comparing July 2012 vs. July 2013. There is a paucity of reported Cap Rates, the few reported are in lower demand areas. There were no large (>100 unit) sales in July 2013. However, July 2012 had several close-in sales which skewed the $/unit number.
We’ll send out a 1H2013 summary and annual project within two weeks, but 2013 looks lower volume than 2012. If you’d like an earlier copy under separate cover, eMail me.
Future directions will be determined by two things:
1) Interest rates – Are gradually increasing which means Cap Rates usually track.
2) Rents – For the next year, we will be hitting a ceiling in rent increases, however demand should stay steady. This means owners need to focus on two things:
a. Getting/keeping good tenants – Even if this means waiting longer on vacancies. If you’ve spent money making your apartments better do advertise this.
b. Managing expenses – The rise in utility rates is inexorable for now, especially water since most water is from the City of Portland which does not need regulatory approval for rate increases. While bill-backs are popular, sub-metering is an option you may want to consider since it encourages tenants to use less water as opposed to a flat fee.
CapRate will vary by location/condition of property. If you’d like a more detailed 5-year summary of 2007-2012 apartment sales sorted by neighborhood, size and age, contact me and I can eMail it or you can find it at:
Side note for apartment owners – The Oregon legislature has passed a bill which will not allow a landlord to base tenant acceptance on whether they use an individual Section 8 voucher for rent payment. Details are at:
http://gov.oregonlive.com/bill/2013/HB2639/
This will become effective 1 Jul 2014.
If you’d like more information on:
– Details/background on individual sales in the report, or
– a Free copy of our 80-page book – Buying, Selling and Operating Apartments Using Financial Analysis
Please contact me:
Steve Morris – Senior Advisor Multi-Units
Sperry Van Ness – Bluestone & Hockley
steve.morris@svn.com / (503) 970-4593
Portland Apartment Market Summary – July 2013
Leave a Comment
<<<PortlandAptMarketReview_WesternBusinessREJournal_Jul13>>>
RIGHT-CLICK ABOVE LINK (and SAVE LINK AS) TO DOWNLOAD THE DETAILED REPORT
Western Real Estate Business was kind enough to publish an article we submitted on the Portland apartment market which you can download at the above link.
Included as topics:
1) New Construction
2) Buyer Focus
3) Tenant Growth
4) Developer Focus
CapRate will vary by location/condition of property. If you’d like a more detailed 5-year summary of 2007-2012 apartment sales sorted by neighborhood, size and age, contact me and I can eMail it or you can find it at:
Side note for apartment owners – The Oregon legislature has passed a bill which will not allow a landlord to base tenant acceptance on whether they use an individual Section 8 voucher for rent payment. Details are at:
http://gov.oregonlive.com/bill/2013/HB2639/
This will become effective 1 Jul 2014.
If you’d like more information on:
– Details/background on individual sales in the report, or
– a Free copy of our 80-page book – Buying, Selling and Operating Apartments Using Financial Analysis
Please contact me:
Steve Morris – Senior Advisor Multi-Units
Sperry Van Ness – Bluestone & Hockley
steve.morris@svn.com / (503) 970-4593
Individual Portland Apartment Sales >$450K – June 2013
Leave a Comment
<<<Portland Apartment Market – June 2013 Sales>>>
RIGHT-CLICK ABOVE LINK (and SAVE LINK AS) TO DOWNLOAD THE DETAILED REPORT
Attached is a list of individual Portland-area sales of apartment complexes greater than $450,000 in June 2013. We’ve included $/unit, $/sqft , unit count, year built and Cap Rate (as reported) and a comparison to June 2012 averages.
COMMENTS – While there is a paucity of reported Cap Rates, the market looks flat with no appreciable change. There were no large (>100 unit) sales in either June 2012 or 2013. However, June 2012 had several close-in sales which skewed the $/unit number.
Future directions will be determined by two things:
1) Interest rates – Are gradually increasing which means Cap Rates usually track.
2) Rents – For the next year, we will be hitting a ceiling in rent increases, however demand should stay steady. This means owners need to focus on two things:
a. Getting/keeping good tenants – Even if this means waiting longer on vacancies. If you’ve spent money making your apartments better do advertise this.
b. Managing expenses – The rise in utility rates is inexorable for now, especially water since most water is from the City of Portland which does not need regulatory approval for rate increases. While bill-backs are popular, sub-metering is an option you may want to consider since it encourages tenants to use less water as opposed to a flat fee.
CapRate will vary by location/condition of property. If you’d like a more detailed 5-year summary of 2007-2012 apartment sales sorted by neighborhood, size and age, contact me and I can eMail it or you can find it at:
Side note for apartment owners – The Oregon legislature has passed a bill which will not allow a landlord to base tenant acceptance on whether they use an individual Section 8 voucher for rent payment. Details are at:
http://gov.oregonlive.com/bill/2013/HB2639/
This will become effective 1 Jul 2014.
If you’d like more information on:
– Details/background on individual sales in the report, or
– a Free copy of our 80-page book – Buying, Selling and Operating Apartments Using Financial Analysis
Please contact me:
Steve Morris – Senior Advisor Multi-Units
Sperry Van Ness – Bluestone & Hockley
steve.morris@svn.com / (503) 970-4593
Individual Portland Apartment Sales >$450K – May 2013
Leave a Comment
<<<May13vsMay12Sales>>>
RIGHT-CLICK ABOVE LINK (and SAVE LINK AS) TO DOWNLOAD THE DETAILED REPORT
Attached is a list of individual Portland-area sales of apartment complexes greater than $450,000 in May 2013. We’ve included $/unit, $/sqft , unit count, year built and CapRate (as reported) and a comparison to April 2012 averages. May 13 had 1 large sale of 300 units which skews the weighed averages.
COMMENTS – Transaction volume has dropped even though there are willing buyers for properties in avg-good shape located in better neighborhoods. These neighborhoods include downtown and close-in East and West Portland. In addition, Hillsboro/Beaverton continue to be the nexus of job growth for the Portland area with Washington county (Beaverton/Hillsboro) expected to exceed the population of Multnomah county (Portland proper) within 20 years.
Sellers are still enjoying net income growth from rent increases due to demand. However, we feel this will level out by year end and the fight to grow net income will re-focus onto expense management.
Side note for apartment owners – The Oregon legislature is considering a bill which will not allow a landlord to base tenant acceptance on whether they use an individual Section 8 voucher for rent payment. Details are at:
http://gov.oregonlive.com/bill/2013/HB2639/
If you feel strongly either way, please be sure to make your elected representative aware of your feelings.
We’ve issued our 2007-2012 history broken down by county. If you’d like a copy, eMail me and I can send under separate cover when done.
If you’d like more information on:
– Details/background on individual sales in the report, or
– 5 year history on the Portland apartment market, or
– a Free copy of our 80-page book – Buying, Selling and Operating Apartments Using Financial Analysis
Please contact me:
Steve Morris – Senior Advisor Multi-Units
Sperry Van Ness – Bluestone & Hockley
steve.morris@svn.com / (503) 970-4593
Individual Portland Apartment Sales >$450K – April 2013
Leave a Comment
<<<Apr13vsApr12Sales>>>
RIGHT-CLICK ABOVE LINK (and SAVE LINK AS) TO DOWNLOAD THE DETAILED REPORT
Attached is a list of individual Portland-area sales of apartment complexes greater than $450,000 in April 2013. We’ve included $/unit, $/sqft , unit count, year built and CapRate (as reported) and a comparison to April 2012 averages. April 12 had 1 large sale of 460 units which skews the weighed averages.
Side note for apartment owners – The Oregon legislature is considering a bill which will not allow a landlord to base tenant acceptance on whether they use an individual Section 8 voucher for rent payment. Details are at:
http://gov.oregonlive.com/bill/2013/HB2639/
If you feel strongly either way, please be sure to make your elected representative aware of your feelings.
We’ve issued our 2007-2012 history broken down by county. If you’d like a copy, eMail me and I can send under separate cover when done.
If you’d like more information on:
– Details/background on individual sales in the report, or
– Free copy of our 80-page book – Buying, Selling and Operating Apartments Using Financial Analysis
Please contact me:
Steve Morris – Senior Advisor Multi-Units
Sperry Van Ness – Bluestone & Hockley
steve.morris@svn.com / (503) 970-4593
Individual Portland Apartment Sales >$450K – March 2013
Leave a Comment
<<<Mar13vsMar12_PortlandAptSales>>>
RIGHT-CLICK ABOVE LINK (and SAVE LINK AS) TO DOWNLOAD THE DETAILED REPORT
Attached is a list of individual Portland-area sales of apartment complexes greater than $450,000 in March 2013. We’ve included $/unit, $/sqft , unit count, year built and CapRate (as reported) and a comparison to February 2012 averages. March 2012 had 2 large sales (264 and 554 units) that skews averages.
Side note for apartment owners – The Oregon legislature is considering a bill which will not allow a landlord to base tenant acceptance on whether they use an individual Section 8 voucher for rent payment. Details are at:
http://gov.oregonlive.com/bill/2013/HB2639/
If you feel strongly either way, please be sure to make your elected representative aware of your feelings.
We’ve issued our 2007-2012 history broken down by county. If you’d like a copy, eMail me and I can send under separate cover when done.
If you’d like more information on:
– Details/background on individual sales in the report, or
– Free copy of our 80-page book – Buying, Selling and Operating Apartments Using Financial Analysis
Please contact me:
Steve Morris – Senior Advisor Multi-Units
Sperry Van Ness – Bluestone & Hockley
steve.morris@svn.com / (503) 970-4593
Individual Portland Apartment Sales >$450K – Feb 2013
Leave a Comment
<<<Feb13vsFeb12_PortlandArea_AptSales>>>
RIGHT-CLICK ABOVE LINK (and SAVE LINK AS) TO DOWNLOAD THE DETAILED REPORT
Attached is a list of individual Portland-area sales of apartment complexes greater than $450,000 in February 2013. We’ve included $/unit, $/sqft , unit count, year built and CapRate (as reported) and a comparison to February 2012 averages. February 2012 had 2 large sales (274 and 255 units) that skews averages.
Sellers are still not very motivated since returns year-over-year on apartments continue to grow. We think this year the growth rate in rents will slow and owners should focus on attracting/keeping good tenants and work on keeping expenses well-managed.
NOTES:
Hot Markets – Multnomah county and Beaverton-Hillsboro are in demand due to jobs, average income and proximity to amenities
Interest Rates – Recently the economy has show some initial signs of strength (after four years we should hope so) and long T-bills have begun to drop in price (which means yields go up). Both of these are indicators of a rise in interest rates. If you have not locked in a long-term loan on your property – DO IT NOW!
We’ve issued our 2007-2012 history broken down by county. If you’d like a copy, eMail me and I can send under separate cover when done.
If you’d like more information on:
– Details/background on individual sales in the report, or
– Free copy of our 80-page book – Buying, Selling and Operating Apartments Using Financial Analysis
Please contact me:
Steve Morris – Senior Advisor Multi-Units
Sperry Van Ness – Bluestone & Hockley
steve.morris@svn.com / (503) 970-4593
Individual Portland Apartment Sales >$450K – Jan 2013
Leave a Comment
<<<Jan13vsJan12_PortlandArea_AptSales>>>
RIGHT-CLICK ABOVE LINK (and SAVE LINK AS) TO DOWNLOAD THE DETAILED REPORT
Attached is a list of individual Portland-area sales of apartment complexes greater than $450,000 in January 2013. We’ve included $/unit, $/sqft , unit count, year built and CapRate (as reported) and a comparison to December 2011 averages. January 2012 had 1 sale of 140 units (plus retail) at $55M that skews averages.
NOTES:
Hot Markets – Multnomah county and Beaverton-Hillsboro are in demand due to jobs, average income and proximity to amenities
Interest Rates – Recently the economy has show some initial signs of strength (after four years we should hope so) and long T-bills have begun to drop in price (which means yields go up). Both of these are indicators of a rise in interest rates. If you have not locked in a long-term loan on your property – DO IT NOW!
We’ve issued our 2007-2012 history broken down by county. If you’d like a copy, eMail me and I can send under separate cover when done.
If you’d like more information on:
– Details/background on individual sales in the report, or
– Free copy of our 80-page book – Buying, Selling and Operating Apartments Using Financial Analysis
Please contact me:
Steve Morris – Senior Advisor Multi-Units
Sperry Van Ness – Bluestone & Hockley
steve.morris@svn.com / (503) 970-4593
Steve Morris - VP with IMG Northwest

You must be logged in to post a comment.