To download the individual sales report, right-click the link below and “Save As”:
Highlights:
- CapRates reported are still in the mid-high 5% compared to 2015 in the high 5% range.
- $/unit Aug 16 YTD is a 7.9% increase over Aug 15 YTD.
- $/SqFt Aug 16 YTD is a 5.6% increase over Aug 15 YTD.
- Aug 2016 YTD sales = $1283M vs. Aug 2015 YTD sales of $1423M
We’re still behind 2015 YTD sales numbers. However, Aug 16 was greater than Aug 15 for monthly sales.
There is a noticeable slow-down in SFR sales in Portland. We anticipate that multi-units will reflect this with pricing and rent pressure moderating compared to 2015.
Interest rates may show a slight increase by EOY. However, this is the Fed giving itself more wiggle-room than an over-heated economy.
If you’d like more information on:
– Details/background on individual sales in the report or a breakdown by neighborhood
– A Free copy of our 80-page book – Buying, Selling and Operating Apartments Using Financial Analysis
Please contact me:
Steve Morris | Senior Advisor
Sperry Van Ness | Bluestone & Hockley
9320 SW Barbur Blvd, Suite 300
Portland, OR 97219
Phone: 503.970-4593 | Fax: 503.222.6459
steve.morris@svn.com | www.svnbluestone.com
OR License # 200202054 | WA License # 24512
All Sperry Van Ness®Offices Independently Owned and Operated
For the Oregon Real Estate Agency Pamphlet click here.
For the Washington Real Estate Agency Pamphlet click here.
Posted in
Apartment Buying,
Apartment Selling,
Portland,
Portland, Salem and Vancouver Apartment Market IssuesTags:
$/sqft,
$/unit,
Apartment Buying,
CapRate,
Clackamas,
Clark,
Multnomah,
transactions,
Washington
To download the individual sales report, right-click the link below and “Save As”:
Highlights:
- CapRates reported are still in the mid-high 5% compared to 2015 in the high 5% range.
- $/unit July 16 YTD is a 7.0% increase over July 15 YTD.
- $/SqFt July 16 YTD is a 6.8% increase over July 5 YTD.
- July 2016 YTD sales = $1077M vs. July 2015 YTD sales of $1252M
Biggest change in YTD gross sales numbers is the drop-off in large (>100 units) sales in the market. These usually comprise 70%-75% of total gross sales in the 4 county are, so any drop is noticeable.
If you’d like more information on:
– Details/background on individual sales in the report or a breakdown by neighborhood
– A Free copy of our 80-page book – Buying, Selling and Operating Apartments Using Financial Analysis
Please contact me:
Steve Morris | Senior Advisor
Sperry Van Ness | Bluestone & Hockley
9320 SW Barbur Blvd, Suite 300
Portland, OR 97219
Phone: 503.970-4593 | Fax: 503.222.6459
steve.morris@svn.com | www.svnbluestone.com
OR License # 200202054 | WA License # 24512
All Sperry Van Ness®Offices Independently Owned and Operated
For the Oregon Real Estate Agency Pamphlet click here.
For the Washington Real Estate Agency Pamphlet click here.
Posted in
Apartment Buying,
Apartment Selling,
Portland,
Portland, Salem and Vancouver Apartment Market IssuesTags:
$/sqft,
$/unit,
CapRate,
Clackamas,
Clark,
Multnomah,
transactions,
Washington
To download the individual sales report, right-click the link below and “Save As”:
Highlights:
- CapRates reported are still in the mid-high 5% compared to 2015 in the high 5% range.
- $/unit June 16 YTD is a 8.7% increase over June 15 YTD.
- $/SqFt June 16 YTD is a 95.5% increase over June 15 YTD.
- June 2016 YTD sales = $939M vs. June 2015 YTD sales of $1026M
If you’d like more information on:
– Details/background on individual sales in the report or a breakdown by neighborhood
– A Free copy of our 80-page book – Buying, Selling and Operating Apartments Using Financial Analysis
Please contact me:
Steve Morris | Senior Advisor
Sperry Van Ness | Bluestone & Hockley
9320 SW Barbur Blvd, Suite 300
Portland, OR 97219
Phone: 503.970-4593 | Fax: 503.222.6459
steve.morris@svn.com | www.svnbluestone.com
OR License # 200202054 | WA License # 24512
All Sperry Van Ness®Offices Independently Owned and Operated
For the Oregon Real Estate Agency Pamphlet click here.
For the Washington Real Estate Agency Pamphlet click here.
Posted in
Apartment Buying,
Apartments - Other Topics,
Portland,
Portland, Salem and Vancouver Apartment Market IssuesTags:
$/sqft,
$/unit,
CapRate,
Clackamas,
Clark,
Multnomah,
sales,
transactions,
Washington
To download the individual sales report, right-click the link below and “Save As”:
Highlights:
- CapRates reported are still in the mid-high 5% compared to 2015 in the low 6% range.
- $/unit April 16 YTD is a 15.2% increase over April 15 YTD.
- $/SqFt April 16 YTD is a 14.5% increase over April 15 YTD.
- April 2016 YTD sales = $674M vs. April 2015 YTD sales of $576M
Rent/Tenant environment – Class A units in close-in locations (especially new construction) are starting to give concessions. We continuously monitor, but be aware that rent growth may be flattening.
Apartment pricing – This will be driven by income growth and interest rates. Based on 2015YTD vs. 2016 YTD we are not seeing the same rate of increase as 2015 vs. 2014.
City of Portland Landlord Training – This is a regular training and very useful, especially with landlord law. We are in process of getting PDFs of the May 16 presentation and will post these and send out a blog notice with a link. If you’d like an earlier copy, eMail me.
YOUR PROPERTY – If you’d like a further breakdown on how in-demand your neighborhood is call. Be aware of the current value of your apartment with unsolicited offers. We offer valuations that include expense analysis with rent and sales comparables to back up any pricing.
If you’d like more information on:
– Details/background on individual sales in the report or a breakdown by neighborhood
– A Free copy of our 80-page book – Buying, Selling and Operating Apartments Using Financial Analysis
Please contact me:
Steve Morris | Senior Advisor
Sperry Van Ness | Bluestone & Hockley
9320 SW Barbur Blvd, Suite 300
Portland, OR 97219
Phone: 503.970-4593 | Fax: 503.222.6459
steve.morris@svn.com | www.svnbluestone.com
OR License # 200202054 | WA License # 24512
All Sperry Van Ness®Offices Independently Owned and Operated
For the Oregon Real Estate Agency Pamphlet click here.
For the Washington Real Estate Agency Pamphlet click here.
Posted in
Apartment Selling,
Portland,
Portland, Salem and Vancouver Apartment Market IssuesTags:
$/sqft,
$/unit,
Apartment Buying,
CapRate,
Clackamas,
Clark,
Multnomah,
Washington
For detail on individual sales, please download the PDF at:
(Right-click link and Save As)
Nov 2015 had $59M in sales in the 4 (OR – Washington, Clackamas and Multnomah and WA – Clark) counties. This is a 25% decrease from Nov 2014 ($79M).
In terms of total sales dollars, 2015 is highest year ever. Nov 15 YTD at $2.058B has easily surpassed 2014 FY sales of $1.6B
Highlights:
-
CapRates reported are still in the mid-high 5% compared to 2014 in the low 6% range.
-
$/unit Nov 15 YTD is a 13% increase over Nov 14 YTD.
-
$/SqFt Nov 15 YTD is a 17% increase over Nov 14 YTD.
-
Projected FY 2015 sales = $2.25B vs. 2014 sales of $1.6B (previous best ever year)
Interest rate environment – The Fed did make a 0.25% increase in overnight funds rates with a threat of future increases this year (2016).
Landlord/Tenant Changes – City of Portland enacted a 90-day notice rule for rent increases >5%. Effective 1 January 2016, Oregon has enacted tenant law changes also. If you’d like a copy of a presentation by Leah Sykes of Bittner-Hahs attorneys, please download it at:
https://portlandapartmentsales.com/2015/11/25/oregon-portland-new-rules-for-apt-owners/
YOUR PROPERTY – If you’d like a further breakdown on how in-demand your neighborhood is call. Be aware of the current value of your apartment with unsolicited offers. We offer valuations that include expense analysis with rent and sales comparables to back up any pricing.
If you’d like more information on:
– Details/background on individual sales in the report or
– A Free copy of our 80-page book – Buying, Selling and Operating Apartments Using Financial Analysis
Please contact me:
Steve Morris | Senior Advisor
Sperry Van Ness | Bluestone & Hockley
9320 SW Barbur Blvd, Suite 300
Portland, OR 97219
Phone: 503.970-4593 | Fax: 503.222.6459
steve.morris@svn.com | www.svnbluestone.com
OR License # 200202054 | WA License # 24512
All Sperry Van Ness®Offices Independently Owned and Operated
For the Oregon Real Estate Agency Pamphlet click here.
For the Washington Real Estate Agency Pamphlet click here.
For detail on individual sales, please download the PDF at:
(Right-click link and Save As)
Oct 2015 had $210M in sales in the 4 (OR – Washington, Clackamas and Multnomah and WA – Clark) counties. This is a 8.4% decrease from Oct 2014 ($230M).
It is official, in terms of total sales dollars, 2015 is highest year ever. Oct 15 YTD at $2B has easily surpassed 2014 FY sales of $1.6B
Oct 2015 had $210M in total sales. Highlights:
-
CapRates reported are still in the mid 5% compared to 2014 in the low 6% range.
-
$/sqft and $/unit. $/unit Oct 15 YTD is a 13% increase over Oct 14 YTD. $/SqFt Oct 15 YTD is a 17% increase over Oct 14 YTD.
-
Projected FY 2015 sales = $2.35B vs. 2014 sales of $1.6B (previous best ever year)
Interest rate environment – Probabilities favor an increase by the Fed by EOY. Then again, stop me if you’ve heard this one before.
Portland backlash – City of Portland enacted a 90-day notice rule for rent increases >5%.
YOUR PROPERTY – If you’d like a further breakdown on how in-demand your neighborhood is call. Be aware of the current value of your apartment with unsolicited offers. We offer valuations that include expense analysis with rent and sales comparables to back up any pricing.
If you’d like more information on:
– Details/background on individual sales in the report or
– A Free copy of our 80-page book – Buying, Selling and Operating Apartments Using Financial Analysis
Please contact me:
Steve Morris | Senior Advisor
Sperry Van Ness | Bluestone & Hockley
9320 SW Barbur Blvd, Suite 300
Portland, OR 97219
Phone: 503.970-4593 | Fax: 503.222.6459
steve.morris@svn.com | www.svnbluestone.com
OR License # 200202054 | WA License # 24512
All Sperry Van Ness®Offices Independently Owned and Operated
For the Oregon Real Estate Agency Pamphlet click here.
For the Washington Real Estate Agency Pamphlet click here.
Posted in
Apartment Buying,
Portland,
Portland, Salem and Vancouver Apartment Market Issues,
Salem and Vancouver Apartment Market IssuesTags:
$/unit,
Apartment Buying,
Capitalization Rate,
CapRate,
Clackamas,
Clark,
Multnomah,
sales,
Washington
RIGHT-CLICK ABOVE LINK (and SAVE LINK AS) TO DOWNLOAD THE DETAILED REPORT
Attached is a list of individual Portland-area sales of apartment complexes greater than $450,000 in May 2015.
Included are $/unit, $/sqft , unit count, year built and Cap Rate (as reported) and a comparison to May 2014 averages.
May 15 had a huge increase in sales over May 14. May 15 had 20 sales for a $60M total vs 12 sales in May 14 for a $15.6M total. YTD shows about a 86% increase over 2014 YTD sales in terms of dollar volume.
May 15 had ONE large (>100 units) sales and May 14 had ZERO large sales.
Total apt sales in 2014 were $1.5B. 2015 is forecast, as of today, at about $1.55B. 2014 had the majority of sales from June thru EOY.
Be aware of the current value of your apartment with unsolicited offers. We offer valuations that include expense analysis with rent and sales comparables to back up any pricing.
If you’d like more information on:
– Details/background on individual sales in the report or
– A Free copy of our 80-page book – Buying, Selling and Operating Apartments Using Financial Analysis
Please contact me:
Steve Morris – Senior Advisor Multi-Units
Sperry Van Ness – Bluestone & Hockley
steve.morris@svn.com / (503) 970-4593
OR Principal Broker License 2002002054 / WA Managing Broker License 24512
RIGHT-CLICK ABOVE LINK (and save target) TO DOWNLOAD COMPLETE REPORT
Attached is a history of Portland apartment sales sorted by neighborhood from 2008 – 2013 of transactions > $450K.
The report covers the Portland Metro area – Clark (WA), Clackamas (OR), Multnomah (OR) and Washington (OR) counties
Contents Include
2008 – 2013 Portland Apartment Market History w/ Comments
2013 Portland Operating Dynamics Trends
2008 – 2013 Sales by County
2008 – 2013 Sales by Neighborhood
2008 – 2013 Sales by Complex Size
2008 – 2013 Sales by Decade Built
2008-2013 Summary by County and Totals
Posted in
Apartments - Other Topics,
Portland, Salem and Vancouver Apartment Market IssuesTags:
$/sqft,
$/unit,
Capitalization Rate,
CapRate,
Clackamas,
Clark,
Marion,
Multnomah,
price,
sales,
transactions,
Washington
RIGHT-CLICK ABOVE LINK (and SAVE LINK AS) TO DOWNLOAD THE DETAILED REPORT
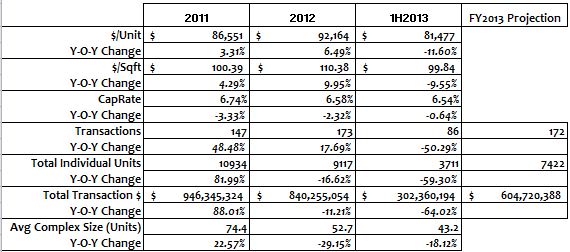
Attached is a list of individual Portland-area sales of apartment complexes greater than $450,000 in August 2013. Included are $/unit, $/sqft , unit count, year built and Cap Rate (as reported) and a comparison to August 2012 averages.
2013 First Half Summary and Projections:

2013 should be about the same volume as 2012 with the exception of fewer large complex sales.
Future directions will be determined by two things:
1) Interest rates – Are gradually increasing which means Cap Rates usually track.
2) Rents – For the next year, we will be hitting a ceiling in rent increases, however demand should stay steady. This means owners need to focus on two things:
a. Getting/keeping good tenants – Even if this means waiting longer on vacancies. If you’ve spent money making your apartments better do advertise this.
b. Managing expenses – The rise in utility rates is inexorable for now, especially water since most water is from the City of Portland which does not need regulatory approval for rate increases. While bill-backs are popular, sub-metering is an option you may want to consider since it encourages tenants to use less water as opposed to a flat fee.
Side note for apartment owners – The Oregon legislature has passed a bill which will not allow a landlord to base tenant acceptance on whether they use an individual Section 8 voucher for rent payment. Details are at:
http://gov.oregonlive.com/bill/2013/HB2639/
This will become effective 1 Jul 2014.
If you’d like more information on:
– Details/background on individual sales in the report, or
– a Free copy of our 80-page book – Buying, Selling and Operating Apartments Using Financial Analysis
Please contact me:
Steve Morris – Senior Advisor Multi-Units
Sperry Van Ness – Bluestone & Hockley
steve.morris@svn.com / (503) 970-4593
RIGHT-CLICK ABOVE LINK (and SAVE LINK AS) TO DOWNLOAD THE DETAILED REPORT
Attached is a list of individual Portland-area sales of apartment complexes greater than $450,000 in July 2013. We’ve included $/unit, $/sqft , unit count, year built and Cap Rate (as reported) and a comparison to July 2012 averages.
COMMENTS – The number of transactions tailed off comparing July 2012 vs. July 2013. There is a paucity of reported Cap Rates, the few reported are in lower demand areas. There were no large (>100 unit) sales in July 2013. However, July 2012 had several close-in sales which skewed the $/unit number.
We’ll send out a 1H2013 summary and annual project within two weeks, but 2013 looks lower volume than 2012. If you’d like an earlier copy under separate cover, eMail me.
Future directions will be determined by two things:
1) Interest rates – Are gradually increasing which means Cap Rates usually track.
2) Rents – For the next year, we will be hitting a ceiling in rent increases, however demand should stay steady. This means owners need to focus on two things:
a. Getting/keeping good tenants – Even if this means waiting longer on vacancies. If you’ve spent money making your apartments better do advertise this.
b. Managing expenses – The rise in utility rates is inexorable for now, especially water since most water is from the City of Portland which does not need regulatory approval for rate increases. While bill-backs are popular, sub-metering is an option you may want to consider since it encourages tenants to use less water as opposed to a flat fee.
CapRate will vary by location/condition of property. If you’d like a more detailed 5-year summary of 2007-2012 apartment sales sorted by neighborhood, size and age, contact me and I can eMail it or you can find it at:
https://portlandapartmentsales.com/2013/02/27/portland-apartment-market-sales-by-neighborhood-2007-2012/
Side note for apartment owners – The Oregon legislature has passed a bill which will not allow a landlord to base tenant acceptance on whether they use an individual Section 8 voucher for rent payment. Details are at:
http://gov.oregonlive.com/bill/2013/HB2639/
This will become effective 1 Jul 2014.
If you’d like more information on:
– Details/background on individual sales in the report, or
– a Free copy of our 80-page book – Buying, Selling and Operating Apartments Using Financial Analysis
Please contact me:
Steve Morris – Senior Advisor Multi-Units
Sperry Van Ness – Bluestone & Hockley
steve.morris@svn.com / (503) 970-4593
Next Page »

You must be logged in to post a comment.