Buying, selling and operating apartments in Portland
Portland-Metro Apartment Sales >$450K in March 2015
Leave a Comment
<<<Portland Apartment March 15 Sales>>>
RIGHT-CLICK ABOVE LINK (and SAVE LINK AS) TO DOWNLOAD THE DETAILED REPORT
Attached is a list of individual Portland-area sales of apartment complexes greater than $450,000 in March 2015. Included are $/unit, $/sqft , unit count, year built and Cap Rate (as reported) and a comparison to March 2014 averages.
March 15 had a huge increase in sales again. March 15 had 21 sales for a $127M total vs 13 sales in March 14 for a $53M total.
March 15 had TWO large (>100 units) sales and March 14 had THREE large sales.
Most of the pricing numbers are being driven by large sales (70% of total sales dollars). However, price increases are across all apartment types due mainly to a lack of inventory for sale (i.e listings.)
Be aware of the current value of your apartment with unsolicited offers. We offer valuations that include expense analysis with rent and sales comparables to back up any pricing.
If you’d like our 5 year (2009-2014) review of the Portland apartment market history, let me know and I’ll send an copy. If you’d like last years report (2008-2013), I can send a copy also.
If you’d like more information on:
– Details/background on individual sales in the report or
– A Free copy of our 80-page book – Buying, Selling and Operating Apartments Using Financial Analysis
Please contact me:
Steve Morris – Senior Advisor Multi-Units
Sperry Van Ness – Bluestone & Hockley
steve.morris@svn.com / (503) 970-4593
OR Principal Broker License 2002002054 / WA Managing Broker License 24512
Feb 2015 – Portland Apartment Sales >$450K
Leave a Comment
<<<Feb15vsFeb14_PortlandAptSales>>>
RIGHT-CLICK ABOVE LINK (and SAVE LINK AS) TO DOWNLOAD THE DETAILED REPORT
Attached is a list of individual Portland-area sales of apartment complexes greater than $450,000 in February 2015. Included are $/unit, $/sqft , unit count, year built and Cap Rate (as reported) and a comparison to Feb 2014 averages.
Feb 15 had a huge increase in sales again. Feb 15 had 25 sales for a $142M total vs 8 sales in Feb 14 for a $48M total.
Feb 15 had TWO large (>100 units) sales and Feb 14 had ONE large sale.
2015 returns will be driven by interest rates and operating dynamics (including vacancy rates in higher end, new construction and expenses growing faster than rents.)
If you’d like our 5 year (2009-2014) review of the Portland apartment market history, let me know and I’ll send an copy. If you’d like last years report (2008-2013), I can send a copy also.
If you’d like more information on:
– Details/background on individual sales in the report or
– A Free copy of our 80-page book – Buying, Selling and Operating Apartments Using Financial Analysis
Please contact me:
Steve Morris – Senior Advisor Multi-Units
Sperry Van Ness – Bluestone & Hockley
steve.morris@svn.com / (503) 970-4593
OR Principal Broker License 2002002054 / WA Managing Broker License 24512
2009-2014 Portland Apartment Market Sales History
Leave a Comment
<<<Portland Apartments Market History_13March15>>>
RIGHT-CLICK ABOVE LINK (and SAVE LINK AS) TO DOWNLOAD THE DETAILED REPORT
We’ve generated our annual 5 year history of the Portland apartment market covering sales >$450K in Clark (WA), Clackamas (OR), Multnomah (OR) and Washington (OR) counties
Topics include:
- Current Market overview
- 2009-2014 Portland market notes
- 2015 Futures/Trends
- 2014 Sales by County (Averages / Largest)
- 2009-2014 Sales by Neighborhood, Complex Size and Decade Built
Any suggestions to make the report more readable are always appreciated.
If you’d like more information on details/background on individual sales in the report or a free copy of our 80-page book – Buying, Selling and Operating Apartments Using Financial Analysis
Please contact me:
Steve Morris – Senior Advisor Multi-Units
Sperry Van Ness – Bluestone & Hockley
steve.morris@svn.com / (503) 970-4593
OR Principal Broker License 2002002054 / WA Managing Broker License 24512
Tags: History, sales
Apartment Sales > $450K for January 2015 in Portland Metro
Leave a Comment
<<<Jan15vsJan14Sales>>>
RIGHT-CLICK ABOVE LINK (and SAVE LINK AS) TO DOWNLOAD THE DETAILED REPORT
Attached is a list of individual Portland-area sales of apartment complexes greater than $450,000 in January 2015. Included are $/unit, $/sqft , unit count, year built and Cap Rate (as reported) and a comparison to Dec 2013 averages.
January 2015 and January 2014 showed a new year’s burst of activity.
The total dollar volume was $164M (Jan 15) vs. $108M (Jan 14). Jan 15 had TWO large (>100 units) sales and Jan 14 had TWO large sales.
Here are a few projections/trends for 2015 to consider:
- 2014 Total sales $ is the best year ($1.49B thru 31 Dec 14) ever in the Portland METRO
- The rent market continues to be strong, but new inventory is coming on line fast in the high-end
- CapRate is only reported and may or may not be actual.
There are few listings that are well-priced and a lot of deals are being done “off-market”. If you are thinking of selling in the next two years, ask us for a valuation with comp sales and financial analysis – A seller’s market is the best time to sell.
2015 returns will be driven by interest rates and operating dynamics (including vacancy rates in higher end, new construction and expenses growing faster than rents.)
If you’d like an early notice of our 5 year (2009-2014) review of the Portland apartment market, let me know and I’ll send an early copy – It should be done first part of March 2015. If you’d like last years report (2008-2013), I can send a copy now.
If you’d like more information on:
– Details/background on individual sales in the report or
– A Free copy of our 80-page book – Buying, Selling and Operating Apartments Using Financial Analysis
Please contact me:
Steve Morris – Senior Advisor Multi-Units
Sperry Van Ness – Bluestone & Hockley
steve.morris@svn.com / (503) 970-4593
OR Principal Broker License 2002002054 / WA Managing Broker License 24512
Portland Apartment – New Construction 2012-2016
Leave a Comment
<<<2012-2017 Apartment Construction>>>
RIGHT-CLICK ABOVE LINK (and SAVE LINK AS) TO DOWNLOAD THE DETAILED REPORT
Attached is a XLS with multi-unit new construction in the Portland METRO area (OR – Multnomah, Clackamas, Washington counties and WA- Clark county.) For reference, the estimated total unit count in the Portland METRO is about 275,000 units. I’ve included a couple of pivot tables to filter, however, here is a summary:
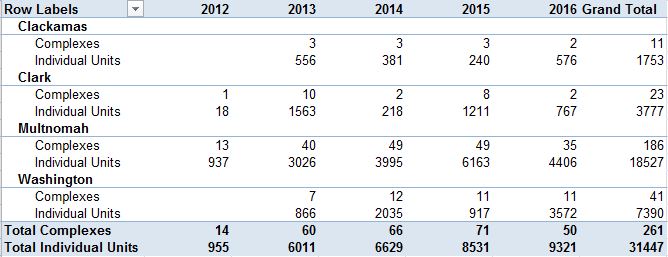
Disclaimers/Notes:
- This is from public records and while should be close, is not guaranteed to be 100% accurate.
- Portland – SubE describes Portland East of NE/SE 82nd, West of 162nd in Multnomah county
- 2012/2013 build dates mean project is done and leased up
- 2014 is in process of lease-up or very close to completion
- 2015 implies in process of construction with completion in 2015
- 2016 implies in planning/permitting process.
- 2017 involves multi-unit lots in Clark county being sold with potential construction.
******
If you’d like more information on:
– Details/background on individual sales or
– A Free copy of our 80-page book – Buying, Selling and Operating Apartments Using Financial Analysis
Please contact me:
Steve Morris – Senior Advisor Multi-Units
Sperry Van Ness – Bluestone & Hockley
steve.morris@svn.com / (503) 970-4593
OR Principal Broker License 2002002054 / WA Managing Broker License 24512
Individual Portland Apartment Sales >$450K – First Half 2014 and Projections
Leave a Comment
<<<2014-FirstHalf_PortlandArea_AptSales>>>
RIGHT-CLICK ABOVE LINK (and SAVE LINK AS) TO DOWNLOAD THE DETAILED REPORT
Attached is a list of individual Portland-area sales of apartment complexes greater than $450,000 for January-June 2014. Included are $/unit, $/sqft , unit count, year built and Cap Rate (as reported) and a comparison to 2009-2014 averages and a 2014 projection.
- There is a lack of inventory which means buyers are driving prices. However, most likely any market change will be related to an interest rate rise.
- Clark county has had a large drop in sales from 2013 so far. However, 2013 had several large sales.
- Clackamas county should have a large jump in sales due to several large sales near Clackamas Town Center.
- Multnomah county took a large jump in $/unit average pricing so far in 2014, this is driven by one large sale at $450K/unit.
- $/sqft and CapRates have remained constant. However, CapRates are REPORTED and not available in all cases. Prime properties in prime locations are <5% CapRates
- While total transaction dollars are probably going to equal 2013 (as of now), total transaction count and total individual units project down from 2013.
We will be posting in the near future:
– A XLS with new apartment construction from 2013 thru estimated 2016 with addresses
As always, if you’d like earlier copies, let me know.
If you’d like more information on:
– Details/background on individual sales or
– A Free copy of our 80-page book – Buying, Selling and Operating Apartments Using Financial Analysis
Please contact me:
Steve Morris – Senior Advisor Multi-Units
Sperry Van Ness – Bluestone & Hockley
steve.morris@svn.com / (503) 970-4593
OR Principal Broker License 2002002054 / WA Managing Broker License 24512
Steve Morris - VP with IMG Northwest

You must be logged in to post a comment.