Buying, selling and operating apartments in Portland
Nov 2015 – Portland Apartment Sales
Leave a Comment
For detail on individual sales, please download the PDF at:
<<<Nov15vsNov14Sales>>>
(Right-click link and Save As)
Nov 2015 had $59M in sales in the 4 (OR – Washington, Clackamas and Multnomah and WA – Clark) counties. This is a 25% decrease from Nov 2014 ($79M).
In terms of total sales dollars, 2015 is highest year ever. Nov 15 YTD at $2.058B has easily surpassed 2014 FY sales of $1.6B
Highlights:
-
CapRates reported are still in the mid-high 5% compared to 2014 in the low 6% range.
-
$/unit Nov 15 YTD is a 13% increase over Nov 14 YTD.
-
$/SqFt Nov 15 YTD is a 17% increase over Nov 14 YTD.
-
Projected FY 2015 sales = $2.25B vs. 2014 sales of $1.6B (previous best ever year)
Interest rate environment – The Fed did make a 0.25% increase in overnight funds rates with a threat of future increases this year (2016).
Landlord/Tenant Changes – City of Portland enacted a 90-day notice rule for rent increases >5%. Effective 1 January 2016, Oregon has enacted tenant law changes also. If you’d like a copy of a presentation by Leah Sykes of Bittner-Hahs attorneys, please download it at:
https://portlandapartmentsales.com/2015/11/25/oregon-portland-new-rules-for-apt-owners/
YOUR PROPERTY – If you’d like a further breakdown on how in-demand your neighborhood is call. Be aware of the current value of your apartment with unsolicited offers. We offer valuations that include expense analysis with rent and sales comparables to back up any pricing.
If you’d like more information on:
– Details/background on individual sales in the report or
– A Free copy of our 80-page book – Buying, Selling and Operating Apartments Using Financial Analysis
Please contact me:
Steve Morris | Senior Advisor
Sperry Van Ness | Bluestone & Hockley
9320 SW Barbur Blvd, Suite 300
Portland, OR 97219
Phone: 503.970-4593 | Fax: 503.222.6459
steve.morris@svn.com | www.svnbluestone.com
OR License # 200202054 | WA License # 24512
All Sperry Van Ness®Offices Independently Owned and Operated
For the Oregon Real Estate Agency Pamphlet click here.
For the Washington Real Estate Agency Pamphlet click here.
Oregon / Portland New Rules for Apt Owners
Leave a Comment
Please download the PDF of a presentation by Leah Sykes of Hahs & Bittner on rule changes that will affect landlords in 2015 and 2016
<<<2015 Changes to Oregon Residential Landlord_19Nov15>>>
Portland backlash – City of Portland enacted a 90-day notice rule for rent increases >5% and no-cause evictions effective 14 Nov 15.
In addition, the state of Oregon has made changes effective 1 Jan 16. Changes will affect:
- Penalties
- Damage assessments
- What is a bedroom (don’t laugh)
- Waivers
- Timing of notices
If you’d like more information on:
– Details/background on individual sales in the report or
– A Free copy of our 80-page book – Buying, Selling and Operating Apartments Using Financial Analysis
Please contact me:
Steve Morris | Senior Advisor
Sperry Van Ness | Bluestone & Hockley
9320 SW Barbur Blvd, Suite 300
Portland, OR 97219
Phone: 503.970-4593 | Fax: 503.222.6459
steve.morris@svn.com | www.svnbluestone.com
OR License # 200202054 | WA License # 24512
All Sperry Van Ness®Offices Independently Owned and Operated
For the Oregon Real Estate Agency Pamphlet click here.
For the Washington Real Estate Agency Pamphlet click here.
Individual Portland Apartment Sales >$450K – Nov 2014
Leave a Comment
<<<Nov14vsNov13Sales>>>
RIGHT-CLICK ABOVE LINK (and SAVE LINK AS) TO DOWNLOAD THE DETAILED REPORT
Attached is a list of individual Portland-area sales of apartment complexes greater than $450,000 in November 2014. Included are $/unit, $/sqft , unit count, year built and Cap Rate (as reported) and a comparison to Nov 2013 averages.
Nov 2014 (vs. Nov 2013) shows a flat market. The total dollar volume was $92M (Nov 14) vs. $106M (Nov 13). Nov 13 had TWO large (>100 units) sales and Sept 14 had THREE large sales.
While things are slowing down from 2013, here are a few projections/trends for 2014 to consider:
- Total sales $ will be the best year ($1.32B thru 30 Nov 14) with projections of $1.4B total in the Portland METRO
- Individual transactions are at 179 thru 30 Nov14.
- $/unit and $/sqFt will reach a record. CapRate is only reported and difficult to confirm.
One trend driving this is that some very large sales in prime locations are driving a lot of sales. Smaller operators are quite happy with returns currently and listings are lower. A lot of deals are being done “off-market”.
2015 returns will be driven by interest rates and operating dynamics (especially vacancy rates in higher end and new construction) due to an influx of new inventory.
If you’d like to know where you stand today, we can do a very thorough analysis on your property and where you stand compared to your neighbors with sales and rent comparables – Call us.
If you’d like more information on:
– Details/background on individual sales in the report or
– A Free copy of our 80-page book – Buying, Selling and Operating Apartments Using Financial Analysis
Please contact me:
Steve Morris – Senior Advisor Multi-Units
Sperry Van Ness – Bluestone & Hockley
steve.morris@svn.com / (503) 970-4593
OR Principal Broker License 2002002054 / WA Managing Broker License 24512
Individual Portland Apartment Sales >$450K – Oct 2014
Leave a Comment
<<<Portland_Oct14vsOct13_AptSales>>>
RIGHT-CLICK ABOVE LINK (and SAVE LINK AS) TO DOWNLOAD THE DETAILED REPORT
Attached is a list of individual Portland-area sales of apartment complexes greater than $450,000 in Octt 2014. Included are $/unit, $/sqft , unit count, year built and Cap Rate (as reported) and a comparison to Sept 2013 averages.
Oct 2014 (vs. Sept 2013) shows a big Year over Year decline. The total dollar volume was $29.4M (Sept 14) vs. $172.0M (Sept 13). In Oct 2013 there were TWO large (>100 units) sales (1 in Vancouver and 1 in Gresham).
While things are slowing down from 2013, here are a few projections/trends for 2015 to consider:
- Total sales $ will probably beat the 2012 record of $1.14B dollars with projections of $1.6B total in the Portland METRO
- Individual transactions will be about from the same as 2013 (=320 sales)
- Individual units sold will be down from 2013 record of 14,956 units
- $/unit and $/sqFt will reach a record
One trend driving this is that some very large sales in prime locations are driving a lot of sales. Smaller operators are quite happy with returns currently and listings are lower. A lot of deals are being done “off-market”.
2015 returns will be driven by interest rates and operating dynamics (especially vacancy rates in higher end and new construction) due to an influx of new inventory.
If you’d like to know where you stand today, we can do a very thorough financial analysis on your property and where you stand compared to your neighbors with sales and rent comparables – Call us.
If you’d like more information on:
– Details/background on individual sales in the report or
– A Free copy of our 80-page book – Buying, Selling and Operating Apartments Using Financial Analysis
Please contact me:
Steve Morris – Senior Advisor Multi-Units
Sperry Van Ness – Bluestone & Hockley
steve.morris@svn.com / (503) 970-4593
OR Principal Broker License 2002002054 / WA Managing Broker License 24512
Individual Portland Apartment Sales >$450K – Sept 2014
Leave a Comment
<<<Portland Apt Sales – Sept 2014>>>
RIGHT-CLICK ABOVE LINK (and SAVE LINK AS) TO DOWNLOAD THE DETAILED REPORT
Attached is a list of individual Portland-area sales of apartment complexes greater than $450,000 in Sept 2014. Included are $/unit, $/sqft , unit count, year built and Cap Rate (as reported) and a comparison to Sept 2013 averages.
Sept 2014 (vs. Sept 2013) shows a big Year over Year decline. The total dollar volume was $29.4M (Sept 14) vs. $172.0M (Sept 13). Sept 13 had FOUR large (>100 units) sales and Sept 14 had ONE large sale. The large sales in Sept 2013 did skew averages up since we use weighed averages for $/unit and $/SqFt.
While things are slowing down from 2013, here are a few projections/trends for 2014 to consider:
- Total sales $ will probably beat the 2012 record of $1.195B dollars with projections of $1.4B total in the Portland METRO
- Individual transactions will be down from the 2013 record of 319
- Individual units sold will be down from 2013 record of 14,956 units
- $/unit and $/sqFt will reach a record
One trend driving this is that some very large sales in prime locations are driving a lot of sales. Smaller operators are quite happy with returns currently and listings are lower. A lot of deals are being done “off-market”.
2015 returns will be driven by interest rates and operating dynamics (especially vacancy rates in higher end and new construction) due to an influx of new inventory.
If you’d like to know where you stand today, we can do a very thorough analysis on your property and where you stand compared to your neighbors with sales and rent comparables – Call us.
If you’d like more information on:
– Details/background on individual sales in the report or
– A Free copy of our 80-page book – Buying, Selling and Operating Apartments Using Financial Analysis
Please contact me:
Steve Morris – Senior Advisor Multi-Units
Sperry Van Ness – Bluestone & Hockley
steve.morris@svn.com / (503) 970-4593
OR Principal Broker License 2002002054 / WA Managing Broker License 24512
Individual Portland Apartment Sales >$450K – August 2014
Leave a Comment
<<<Aug14vsAug13Sales>>>
RIGHT-CLICK ABOVE LINK (and SAVE LINK AS) TO DOWNLOAD THE DETAILED REPORT
Attached is a list of individual Portland-area sales of apartment complexes greater than $450,000 in August 2014. Included are $/unit, $/sqft , unit count, year built and Cap Rate (as reported) and a comparison to July 2013 averages.
August 2014 (vs. August 2013) shows a big Year over Year bounce. The total dollar volume was $358M (Aug 14) vs. $23M (Aug 13). August 13 had ZERO large (>100 units) sales and August 14 had FIVE large sales. The large sales in August 2014 did skew averages up since we use weighed averages for $/unit and $/SqFt.
The issue continues to be a paucity of smaller listings and listings in general with buyers driving pricing with their demand across the range. Again, look out for any long-term interest rate increases which will be a damper on pricing.
Clark county continues to show fewer sales than last year. However, the projected total sales dollars should easily eclipse 2013 sales ($1.06B in 2013 vs. a projection of $1.4B in 2014) while sales in terms of complexes/individual units will drop. Large sales are skewing total sales volume.
If you’d like more information on:
– Details/background on individual sales in the report or
– A no-0bligation in-depth financial analysis of your apartment with income/expense comps to your neighbors and comparable sales/rents or
– A Free copy of our 80-page book – Buying, Selling and Operating Apartments Using Financial Analysis
Please contact me:
Steve Morris – Senior Advisor Multi-Units
Sperry Van Ness – Bluestone & Hockley
steve.morris@svn.com / (503) 970-4593
OR Principal Broker License 2002002054 / WA Managing Broker License 24512
Individual Portland Apartment Sales >$450K – July 2014
Leave a Comment
<<<July14vsJuly13Sales>>>
RIGHT-CLICK ABOVE LINK (and SAVE LINK AS) TO DOWNLOAD THE DETAILED REPORT
Attached is a list of individual Portland-area sales of apartment complexes greater than $450,000 in July 2014. Included are $/unit, $/sqft , unit count, year built and Cap Rate (as reported) and a comparison to July 2013 averages.
July 2014 (vs. July 2013) show pretty much the same pattern and metrics. July 13 had ONE large (173 units in Vancouver) sale and June 14 had ONE large sale (>100 units). The large sales in July 2014 did skew averages up since we use weighed averages for $/unit and $/SqFt.
The issue continues to be a paucity of smaller listings and listings in general with buyers driving pricing thru their demand. Again, look out for any long-term interest rate increases which will be a damper on pricing.
Clark county continues to show fewer sales than last year. However, the projected total sales dollars should easily eclipse 2013 sales ($1.06B in 2013 vs. a projection of $1.4B in 2014) while sales in terms of complexes/individual units will drop. Large sales are skewing total sales volume.
If you’d like more information on:
– Details/background on individual sales in the report or
– A Free copy of our 80-page book – Buying, Selling and Operating Apartments Using Financial Analysis
Please contact me:
Steve Morris – Senior Advisor Multi-Units
Sperry Van Ness – Bluestone & Hockley
steve.morris@svn.com / (503) 970-4593
OR Principal Broker License 2002002054 / WA Managing Broker License 24512
Portland Apartment – New Construction 2012-2016
Leave a Comment
<<<2012-2017 Apartment Construction>>>
RIGHT-CLICK ABOVE LINK (and SAVE LINK AS) TO DOWNLOAD THE DETAILED REPORT
Attached is a XLS with multi-unit new construction in the Portland METRO area (OR – Multnomah, Clackamas, Washington counties and WA- Clark county.) For reference, the estimated total unit count in the Portland METRO is about 275,000 units. I’ve included a couple of pivot tables to filter, however, here is a summary:
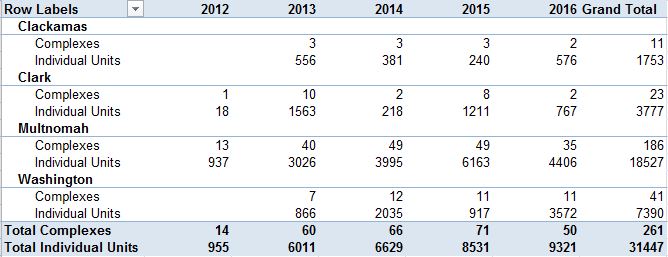
Disclaimers/Notes:
- This is from public records and while should be close, is not guaranteed to be 100% accurate.
- Portland – SubE describes Portland East of NE/SE 82nd, West of 162nd in Multnomah county
- 2012/2013 build dates mean project is done and leased up
- 2014 is in process of lease-up or very close to completion
- 2015 implies in process of construction with completion in 2015
- 2016 implies in planning/permitting process.
- 2017 involves multi-unit lots in Clark county being sold with potential construction.
******
If you’d like more information on:
– Details/background on individual sales or
– A Free copy of our 80-page book – Buying, Selling and Operating Apartments Using Financial Analysis
Please contact me:
Steve Morris – Senior Advisor Multi-Units
Sperry Van Ness – Bluestone & Hockley
steve.morris@svn.com / (503) 970-4593
OR Principal Broker License 2002002054 / WA Managing Broker License 24512
Steve Morris - VP with IMG Northwest

You must be logged in to post a comment.